2024 U.S. Olympic Bid Cities: A Ranking

Olympic Rings

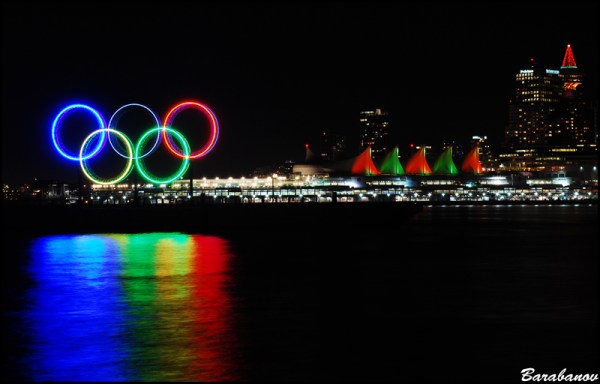
Two years from today, we will be right in the middle of the Olympics in Rio de Janeiro. While the next 24 months will be pocked by stories of construction behind schedule and the exorbitant costs of the darn thing (rightfully so), we’ll brush the controversies aside come August 2016 and enjoy the Games.

The London Olympics were the most-watched television event in American history, and Rio 2016 is going to blow those ratings out of the Thames. Rio is only one hour ahead of the U.S. East Coast, the scenes of Sugarloaf Mountain and Copacabana will be positively gorgeous and NBC will put the names Katie Ledecky, Simone Biles and Mary Cain into the America’s Sweetheart hype machine and make them national conversation pieces.

No matter how it comes about, Americans love the Olympics. We shake our heads at the cost and the needlessness, but then we inevitably watch. Soon enough, the Games will be back in the States, because International Olympic Committee (IOC) members know we love it and will pump even more ridiculous millions in ticket revenue, sponsorships and plushy mascots than the Brazilians will.

Getting the Games

Quick synopsis of how your city gets to host the Olympics:

  1. Your National Olympic Committee must decide that it wants to be in the race at all. The USOC has not bid for the Winter Olympics since Salt Lake City hosted in 2002, and it abstained from the 2020 Summer Olympics race (Tokyo will host in 2020.)
  2. Your city must beat other cities from your nation to be the bid city. We are in the midst of this “race” now. Many American cities expressed interest in bidding for the 2024 Games, but the USOC has narrowed the field to four finalists and will likely pick one by the end of 2014. More on those in a moment.
  3. Your bid must campaign and earn more votes from the IOC than the bids from other international cities. Tokyo beat out Istanbul and Madrid to host the 2020 Olympics. For 2024, people in the know expect Istanbul, Paris, Rome, Doha and Cape Town (or another South African city) to be among the challengers. The votes will be cast in 2017.

The four finalists for the American bid are: Boston, Los Angeles, San Francisco and Washington, D.C.

Now, I was able to write most of that paragraph from memory because I have spent years reading about the Olympic bidding process and the millions of dollars city boosters spend just to be considered as a host for the Games. It’s amazing how much free time you have if you can’t get dates.

Even if you’re a person who does have a social life, you may recall that the last American Olympic bid came from Chicago for the 2016 Games. Chicago’s bid was, to my eyes, a fantastic proposal. It was pretty: Beautiful images of events on Lake Michigan with a skyline view dotted the bid book. It was technically sound: a compact area of venues that included 11 sports under one roof. It was relatively economical: about $4.3 billion and over 90% privately-funded.

Chicago Olympics

Chicago’s Olympic plans were absolutely gorgeous — but they lost.

It finished last. Chicago got the fewest votes of the final four candidates in a shocking vote. How? Pick a reason. The IOC and USOC were in a dispute over revenue shares. IOC members were more dazzled by the possibilities of the first South American Games and didn’t see Chicago as an alpha international city. They didn’t like the Blues Brothers. Who’s to say?

No matter the reason, we can draw a lesson from the 2016 debacle: the American candidate must compete with the beauty of Paris and Rome, outshine the allure of the first African Olympics and provide a desirable alternative to the billions Qatar is willing to spend on drop-thousands-of-migrant-workers-dead-gorgeous stadiums.

To a lesser extent, the bid city must demonstrate ability in the IOC’s “technical categories” like: Hotels and accommodations, sound finance, city infrastructure, government and public support, Olympic Village and sports venue plans, security, transport and what the IOC calls “legacy.”

But really, these are secondary. Rio scored 5th in these technical rankings during the 2016 bidding and still won. If you’ve been paying attention, you noticed there were only four finalists for 2016. Rio, the eventual Olympic host, got a worse score than Doha, which was eliminated by the IOC before the finals. Don’t try to understand the IOC. Just impress them.

Let’s go to my rankings.

4. Washington, D.C.

National Mall

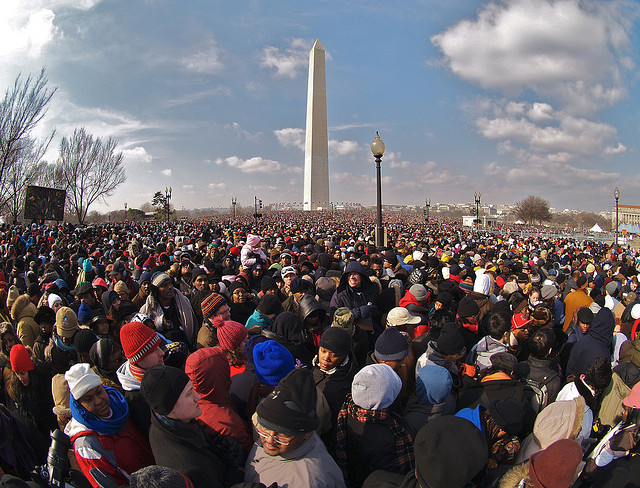
We know one thing: D.C. can handle huge crowds. (Alexander Torrenegra/Creative Commons)

My first thought on a DC Olympics: where the hell are all the venues going to be?

Within the district, you have RFK Stadium (plans would demolish it and build the Olympic Stadium on the site), Nationals Park, Verizon Center and the gyms for George Washington and American University. You can do some neat stuff like beach volleyball on the National Mall, but you’ve still got dozens of other sports to house with nowhere close to go. Think President Clinton will make room for archery on the White House lawn?

D.C.’s proposal for the 2012 American candidacy (it lost to New York City) put several sports in Baltimore, 35 miles away. Sounds feasible enough, but consider that Chicago’s Olympic plan put 85% of the sports venues within 12 miles of the city center. The IOC prefers a compact venue plan for athletes and fans, and if you’re including far-flung venues, you should have a better reason than “Baltimore has more room for a basketball arena.”

Look, any of the four finalist cities would put together a fantastic Olympics. They all have thousands of hotel rooms, world-class infrastructure and transportation systems, sports venues that other nations would envy and enough corporate support to stave off taxpayer subsidies of the Games.

But of the four finalists, a “Washington-Baltimore Olympics” sounds the least romantic. This bid would mostly serve as fodder for bad jokes like my “archery on the White House lawn” bit, and I don’t see the IOC falling in love with D.C. after seeing their Games in London, Rio and Tokyo.

Maybe some Congressmen will volunteer so they can block javelins as well as they block legislation. << (great joke)

3. Boston

Fenway Park

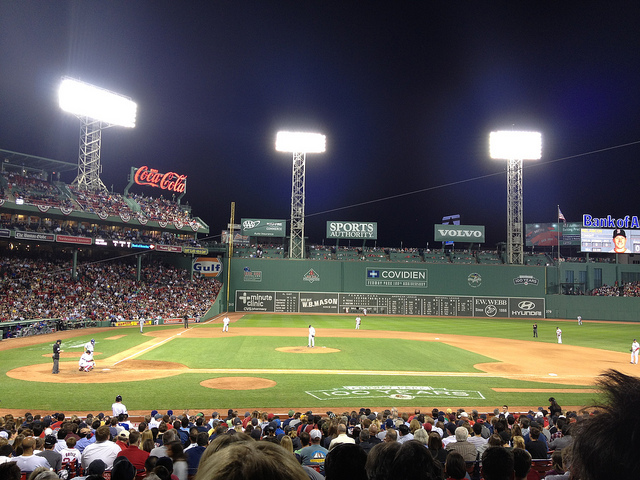
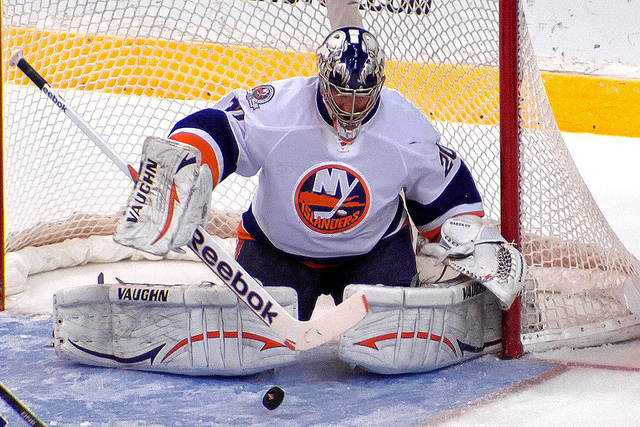
Even if baseball doesn’t return to the Olympic program, you’d see Fenway Park involved in a Boston Games. (Chrissy R/Creative Commons)

There’s a lot to like in a Boston bid. It is a beautiful city in the summertime, with plenty of waterfront and historical sites to emphasize in a pitch for the Olympics. The temperatures would be milder than Atlanta’s, the local colleges and universities provide several venues and thousands of bed spaces, and boy, doesn’t the idea of the Olympics in Boston just sound nice?

The international sports community already knows Boston through the Marathon, and that can be their conduit to letting the IOC know “hey, we’re a great sports city for more than just a 26-mile run.” And it is a great sports city that I feel would get ample support for an Olympic bid, even if concern trolls may point to the bombings and drop terms like “security issues.”

All in all, it is hard to find too many flaws in a Boston bid. You need a spot for the Olympic Stadium (it could be temporary, as Chicago planned) and maybe some upgrades to public transit, but I give the city a fighter’s chance against San Francisco and Los Angeles for the U.S. candidature. If I have a qualm, it would be that Boston doesn’t carry the same international prestige or recognition as Rome, Paris or Istanbul. That may be difficult to overcome in front of the IOC.

2. Los Angeles

U.S. Olympic team 1984

The 1984 Los Angeles Games were an unmitigated success.

If you’re someone who hates the idea of the United States hosting the Olympics, this is the bid to support.

You say, “new stadiums are unnecessary and will just become white elephants.” Los Angeles already has all the venues it needs within L.A. County.

You say, “I don’t want my taxes paying for a two-week party.” A Los Angeles Olympics would use no taxpayer money.

You say, if you’re an Angeleno, “the traffic will be a mess.” This is a particularly L.A. kind of concern, but one that never materialized when Los Angeles hosted the 1984 Olympics. Some say the freeways were never more open.

L.A.’s successful hosting efforts in 1984 both count as the bid’s biggest strength and its biggest weakness.

On one hand: the 1984 Games turned a $232.5 million profit, and a $93 million surplus created a youth sports endowment that continues to grow. It proved that L.A. can host a fantastic Olympics that will be loved by both sports fans and fiscal responsibility fans. In the late ’70s, much of the world felt the Games were expensive, unsafe boondoggles (sound familiar?), and many say Los Angeles “saved” the Olympics.

On the other: the idea of another Los Angeles Olympics may strike a “been there, done that” chord with the IOC. Even a 40-year gap between Games may not be enough for the elder contingency of the IOC. Only Paris has gone less than 52 years between hosting stints. Only London has hosted three times. These should be thought of more as exceptions than as proof it can be done.

A new indoor NFL stadium, Staples Center, Galen Center, Frank Gehry-designed concert hall, revitalized riverfront, rail system, soccer stadium and other venues are all post-1984 creations. But we can easily imagine the IOC looking at an Olympics centered around the Los Angeles Memorial Coliseum and thinking, “haven’t I seen this before?”

1. San Francisco

San Francisco America's Cup

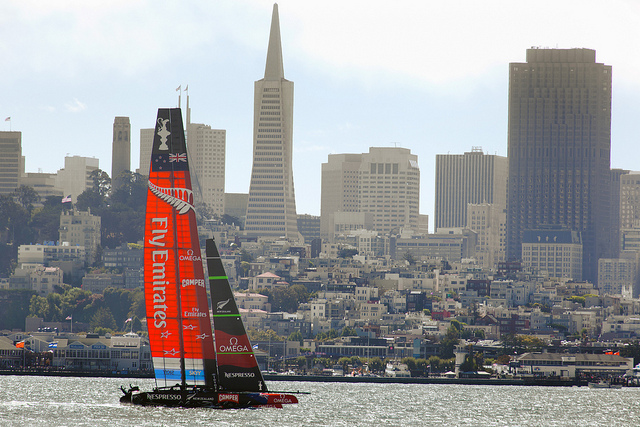
San Francisco showed off its beauty to the sports world during the America’s Cup. (Robert Couse-Baker/Creative Commons)

Let me paint you a picture. Not an actual one. A word picture.

The Opening Ceremonies in a new stadium at Candlestick Point, sailing on San Francisco Bay as in last year’s America’s Cup, marathoners and cyclists crossing the Golden Gate Bridge on a foggy morning, an American gymnastics gold medal in a new waterfront arena for the Warriors, equestrian through Golden Gate Park, whatever use they can find for beautiful AT&T Park…

Sorry, I think I drooled on my keyboard a little bit.

It sounds breathtaking. It would be breathtaking.

Okay, but what about the technical aspects? San Francisco proper is too packed for more sports arenas (they’d have to build out onto the water for the Warriors). Luckily, Oakland and Berkeley are a lot closer than Baltimore is to Washington.

Traffic is an absolute concern, but this is a rail-heavy area that could be even more accessible if the California high-speed-rail plan can ever leave the station. The Bay Area has a smaller population than the L.A. or D.C. regions, but the corporate money would be almost unmatched.

Here’s the issue: San Franciscans. Of the four cities, I think you’ll get the least public support from denizens of the Bay. And they’re not wrong! The Olympics can be costly and a headache, and if you’re already happy with San Francisco the way it is, no wonder you don’t want five rings coming to town. I don’t think a Bay Area Olympics would be particularly bad on the citizenry, but NIMBYs gonna NIMBY.

But San Francisco can win on an international stage. Their bid team will present the same images I did above, just with a million-dollar communications team and fancy renderings. If you need a city that can win a beauty contest with Paris, Rome and Cape Town, SF can do it.

It may be selfish, but I want to see the Olympics in the United States. I was only four years old when Atlanta hosted, so I have no memories of it, only a dusty purple hat. I know the U.S. can host a wonderful Games, and I’d like to see it happen.


Knowing Advanced Metrics: The Four Kinds of Player Stats

Billy Heywood Little Big League

All stats are not equal. Some of the more ignorant opponents of the sabermetrics or fancy-stats revolutions tend to characterize advanced stats like the obscure numbers Twins broadcaster Wally Holland pulls out in the movie Little Big League: “Lou, by the way, has hit .416 lifetime versus Hanley in the month of September in even years, so that certainly bodes well for this at-bat!”

That’s a stat, sure. But it doesn’t bode well for the at-bat, nor is it useful whatsoever beyond illustrating that variance is cuh-raaaaazy.

Proper understanding of sports statistics and analytics means understanding that there are different categories of stats, and media members often mislead you if you’re not paying attention.

So what are these categories? In Day 2 of the 365-day BlogForAYear project, I try to parse it out.

1. Trivia

Think about Little Big League or kind of weird player facts you see on baseball video boards. Real example from last night at PNC Park: “Travis Snider has gone 8-for-21 (.381) with two home runs in his 10 games played on Mondays this season.” That stat is obviously trivial; you will never see Pirates manager Clint Hurdle explain his lineup card for next Monday’s game by saying, “Well we trust Snider to put up great numbers on Mondays. The guy never gets bummed out that the weekend is over.”

When it’s useful:

It is fine to toss out notes of trivia, especially during television and radio broadcasts of games. Sports are entertainment. They are many other things, but they are entertainment, and finding little nuggets within the numbers adds to the fun of it. Jayson Stark traffics in the strange-but-awesome stats that pop up in baseball, and it’s a very fun way to look at the game.

When it’s harmful:

Evgeni Nabokov Islanders

Evgeni Nabokov, author of “Lolita.” (clydeorama/Creative Commons)

TV broadcasts very often present trivia stats as if they were evaluative or trend indicators. For example, you might hear during an NHL game this season: “Evgeni Nabokov has great career numbers against Columbus: 20-5-3, .932 save percentage, 1.79 goals against average, better than he has against any other team. He really seems to have the Blue Jackets’ number, doesn’t he?”

(Note: Fake example in that I’ve never heard this said, but the numbers are real.)

The issue here is not one of small sample size per se. That’s 29 games of NHL action to contend with, and lord knows we draw judgments on goalies around Christmas when they are about 29 starts into their season.

Instead, consider the context of the sample: most of these games come from (A) when Nabokov was a better goalie and a Vezina candidate, (B) when the Columbus Blue Jackets were largely locked in the Western Conference basement with no sunlight and everyone put up good numbers against them, and most importantly (C) when the Blue Jackets players and Nabokov’s teammates were completely different individuals than we see today.

These are the trouble spots: the stats that sound like they are indicative of what we will see in tonight’s Lightning-Jackets game, but are really just frivolous or nothing more than “a neat little fact.” Now, I’m not opposed to frivolity; I have more than 52,000 tweets. But fans, and especially sports gamblers, must be wary of broadcasters presenting trivia that could be interpreted as a more substantive stat.

2. Story Stats

These are the box score stats. They show up in the newspaper or the online game recap to tell you how the game was won.

“[Geno] Smith, responsible for 11 turnovers over the first four games, played mistake-free and threw three touchdown passes while completing 16-of-20 passes for 199 yards in the first road victory of his young career.” — Jets-Falcons recap from Monday, Oct. 7

When it’s useful:

There is absolutely a story in that game recap. Geno Smith put up poor stats in the previous games but played better to lead the Jets to victory. Beautiful! Perfect for a game recap. As long as you realize the stats represent “this is how Geno Smith led the Jets to a win” and not “this is why Geno Smith is a good quarterback who is turning things around,” you’re doing it right.

Scoring two goals in a game, going 8-for-13 in a series with 6 RBI, averaging 28 points per game during this postseason… all examples of stats that tell the story of a player having success and being a part of his team’s wins. The numbers construct their own little narrative, and that’s useful.

How did the Lakers win last night? “Oh, Nick Young just went off. 41 points, 14-of-23 from the field, 6-for-11 from beyond the arc. He was insane!” Cool, got it.

Robots aren’t taking your job, sports recap writers, but they’ll try. Robots never sleep.

When it’s harmful:

It only took me until Day 2 of 365 for me to use the xkcd comic.

xkcd all sports commentary

The problem comes in the post-game shows and the newspaper columns — TV analysts and writers take a one-game performance or stat line and use it to judge a player.

Worst of these are the narratives of “clutch,” and these seem to pop up in every sport. Make a couple late mid-range buckets? Clutch shooter! A pair of game-winning singles? Clutch hitter! Lead a few 4th-quarter comebacks? Clutch quarterback! We as a nation had an honest-to-God national conversation about Tim Tebow because of the flimsy narrative device of “clutch.” Derek Jeter’s brand is built on being “Captain Clutch.” It’s why he has this list of gorgeous ladies notched into his bedpost and you do not.

For years, the line in baseball was that there is no such thing as clutch. Nate Silver wrote in 2008 that “clutch hitting ability exists,” but admits the data proving it may be better defined as “smart situational hitting” than some sort of mental strength. I haven’t looked too far into the arguments in other sports, but there’s a reason NBA savant Zach Lowe writes about “clutch” in quotation marks.

Yet there is a reason that “clutch” and other story-stats-as-narrative-tools propagate.

“There is a strain of journalism as hero worship, a strain that asks us to believe that sports are tests of character, that those who come through at key moments of the game have reached down deep inside themselves and found the strength and courage to succeed. I don’t want to get into that.” — Bill James, The Hardball Times Annual 2008

The upshot of James’ look at whether a clutch hitter exists or not? “We don’t know.” You should use the same kind of skepticism when a media member presents a story stat as a referendum on a player’s ability in crunch time.

3. Evaluative Stats

When they’re analyzed the right way, advanced metrics can be proper evaluations of a player’s skill level. In the absence of a scouting report, these numbers can indicate that a player is great, above-average, average, below-average or poor. This is analytics.

When it’s useful:

I have this photo from a Nate Silver lecture saved in my phone. It comes from his must-read book The Signal and the Noise.

Nate Silver What Makes Data Rich

Break it down. Advanced metrics are strong evaluation tools when they have quantity. The concept of “puck luck” in hockey stems from the idea that a player scoring a goal (or being denied one) is defined largely by unexpected bounces and turns of the puck. It’s not all about skill.

The effects of puck luck can be smoothed out with a large enough sample. Take Jarome Iginla’s stats from this five-year sample.

Year 		Goals/Game	Points/Game
05-06		.43		 .82
06-07		.56		1.34
07-08		.61		1.20
08-09		.43		1.09
09-10		.43		 .92

Iginla’s true talent in that five-year period is not .82 points per game and it’s not .61 points per game. But when you pull it all together, you have a player you can expect to score about 1.05 points and .48 goals per game. And wouldn’t you know it, in the 2010-11 season, Iginla averaged 1.05 points and .52 goals per game. Take a large sample and your data almost always becomes more reliable.

For quality and variety, you want to make sure the player’s stats are being put up:

  • against both good and bad opponents (strength of schedule metrics are quite common these days)
  • in offensive-friendly and defensive-friendly venues (this mostly applies to baseball and football)
  • with different groups of teammates if possible (especially in basketball, hockey and soccer, where the ball and puck flow through many players).

Helpfully, you don’t need a degree in applied mathematics to synthesize all these factors. Guys and gals who do possess such degrees have dumped the numbers into a science machine to spit out a wonderful invention: projections!

I include projections in evaluative stats category because they are based entirely on the evaluative stats and factors mentioned above. Biff the Sabermetrician doesn’t have a Grays Sports Almanac; all he has is a database of what has happened in the past and some algorithms.

The NFL has KUBIAK projections. MLB has PECOTA and ZiPS and a bunch of others. The NHL has VUKOTA. The NBA has SCHOENE, the folks on Twitter tell me. They aren’t just for forecasts; use these projections as part of your evaluation of a player.

When it’s harmful:

Never! Advanced metrics are the best!

Well, mostly, players don’t want to hear about it. They don’t really care about their WAR or their Corsi or their DVOA. And in most cases, they don’t need to care. The players themselves are inadvertent data collectors in most cases. Yasiel Puig’s job is to hit the ball hard, not to worry about his BABIP. But his general manager should care very much about BABIP and all the other metrics when considering the value of a contract extension.

If you’re a baseball fan, you don’t need to understand or even subscribe to sabermetrics. You can totally enjoy the game without it, and people have been doing so for a century. It’s fine! But fans need to understand that general managers and baseball operations staff do subscribe and use advanced metrics to make decisions. If you want to criticize their moves, start reading up the evaluative stats or I will chastise you on Twitter. And I’m very good at it. That shirt looks stupid on you.

4. Trends

This last group of stats doesn’t fit too neatly into any of the other three categories. Anyone who has ever played pickup basketball knows the feeling of being “in the zone” like you can’t miss, or on the other side, feeling totally out of sorts. Therefore: trends!

When it’s useful:

A goalie maintaining a 140-minute shutout streak is kind of trivia and kind of a story, but it also indicates that he could be in a groove of goaltending, however much you want to put stock into how long the streak is likely to continue.

Pedro Alvarez Creative Commons

Pedro Alvarez presents an example of trends being useful. (Keith Allison/Creative Commons)

An opposite baseball example: third baseman Pedro Alvarez has committed 23 throwing errors this season (or one throwing error every four games), and no sane person watching his throws would regress those numbers or draw on a larger sample size and expect those error numbers to go down. He simply looks like a player who can’t make a throw from third base.

Just as we recognize slumps, we can see when a player looks better than he usually does. We now theorize that the “hot hand” in basketball really does exist, per a study by three Harvard graduates. When the smarties controlled for the increasingly difficult shots taken by the “hot hand” player (you can read why in the study), a hot shooter feels “from 1.2 to 2.4 percentage points in increased likelihood of making a shot.”

It’s not much, but it’s not nothing.

When it’s harmful:

During my first draft of this post, I included only three kinds of player stats but eventually felt trends were just barely worthy enough to get their own category.

However, we must be careful not to overrate the effects of a hot hand or a hot bat. The Thunder wouldn’t give the last shot to Jeremy Lamb over Kevin Durant just because Lamb made his three previous shots. A hot hand is not an unstoppable hand.

That fact doesn’t stop writers and broadcasters from using too many small-sample-size stats to draw large conclusions. Always be on the lookout for numbers that have arbitrary endpoints like “in the last 63 games” or “since May 5.” Chances are the media member is cutting off at the perfect spot on a game log in order to make his or her point. Those aren’t trends, they’re cherry-picking.

A final note on trends: they are usually not as good a signal of future performance as projections are. Mitchel Lichtman studied the reliability of season stats compared to projections, and found that using projections can fight our recency bias. “Until we get into the last month or two of the season, season-to-date stats provide virtually no useful information once we have a credible projection for a player.”

Billy Butler’s having a rough year? He’ll probably come back from it. Nelson Cruz is hitting over his head? He’ll probably come back down to earth. You don’t know much about advanced metrics? Keep reading my blog, I’ll try to help.

BlogForAYear: I’m Going to Write Every Day for the Next 365 Days

“If you want to be a writer, you must do two things above all others: read a lot and write a lot. There is no way around these two things that I am aware of, no shortcut.” — Stephen King

I have never read one of Stephen King’s stories, and I am not even certain I want to be a writer. I will take the man’s advice anyway.

I try to read a lot, from books to blog posts to articles that I gather into Pocket. So I have that part covered. Now it is time to write again. I wrote a lot for school and for Pirates Prospects, but those were required tasks to get a diploma or United States currency.

For the last few Januarys, my New Year’s resolution has been to write every day for the following year. I never followed through on it. Self-improvement? That’s loser talk!

Calvin and Hobbes New Year's Resolution

You said it, Cal. Now go pee on something.

Somehow, it seems like the right time to make good on this “write every day for a year” idea. Dorseyville Middle School had posters defining what makes a smart goal: SMART. Apparently the concept developed from George T. Doran that goals should be:

  • Specific – target a specific area for improvement.
  • Measurable – quantify or at least suggest an indicator of progress.
  • Assignable – specify who will do it.
  • Realistic – state what results can realistically be achieved, given available resources.
  • Time-related – specify when the result(s) can be achieved.

My goal seems to fit the criteria. I’m going to write one blog post every day for the next 365 days. Sounds SMART.

So… what will I write about?

If you follow me on Twitter and pay even a smidgen of attention to my tweets, I’m very very sorry you have some idea of my interests. These include (again in bullet form. It’s a blog!):

  • Baseball
  • Advanced metrics in sports
  • Digital journalism
  • Social Media
  • Apple devices
  • TV comedies
  • Pittsburgh
  • The Olympic Games
  • Travel
  • Theme Parks
  • Horrible, horrible “jokes”

I already have some ideas for a few of the next 365 days. You can expect posts mostly revolving around those topics listed, along with whatever tickles the fancy of a thus-far-unemployed 22-year-old who has more free time than he has good sense.

There will be a decent portion of navel-gazing (It’s a blog!), though hopefully four years at fancy writer school have conditioned me to consider the audience — more specifically, how little the audience cares about what I ate for lunch. Pasta with pesto.

At the same time, I am doing this for free. I will often write about whatever I damn well please. Why don’t you take it and shove it into your RSS reader? (I recommend feedly.) There are many people out there who have no trouble writing every day. We call these people “writers.” But this is more of a commitment for your ol’ pal James, so I want to have a wide range of possible topics from which to pull.

So what won’t you see over the next year? I probably won’t write much about personal relationships, which is kind of a shame because that kind of writing can be super interesting and juicy when it is done well. See: My Week on Tinder, a delicious romp through casual dating from comedian Christina Walkinshaw.

Eiffel Tower Paris Instagram

While you’re here, I’m also on Instagram — JamesSantelli. This is from last month in Paris. Look how worldly I am.

Another goal of this project is for me to get into the habit of editing and revising. If I am going to be a journalist, I need to practice those activities. I’ll aim to step away from a post for a while and come back and re-read it before publishing. That wrinkle (and my erratic personal schedule) will mean some posts go up at 2 a.m. and some go up at 6:30 p.m. The goal remains the same: one new post, every day until August 11, 2015.

Ohhhhhhh-kay, I think all that business is out of the way. My real hope here is that you, the reader, enjoys this lil’ project. Many of you have tweeted at me that you enjoyed my writing at Pirates Prospects. Some of you have even told me in-person, and I was probably super awkward about it! Either way, it really does mean the world to me that anyone is taking the time to read the words I write, let alone actually deeming it “good.” So I thank you.

As for housekeeping: best ways to reach me are by email (jrsantelli@gmail.com) or on Twitter (@JamesSantelli). Friends and family will tell you I have only two modes: (1) on Twitter, (2) sleeping. Hell, I even have a hashtag for this charade: #BlogForAYear. Maybe some similar nutjobs will join me and try out their own mid-year New Year’s resolutions. Your life starts today, not on January 1. Let’s do this.

By the way, this counts as Day 1.

August Madness: Handball has NCAA Tournament vibe

(This piece originally appeared on NBCOlympics.com on August 8, 2012.)

These are dark times for college basketball aficionados. The start of the season is more than three months away, and even hardcore hoops fans can admit that March seems like a distant memory.

Have no fear, bracketologists, handball is here. The sport is exciting, fast-paced, and now in the final week of the Olympic tournament, every game becomes crucial. Reminds us of another prominent event: the NCAA Basketball Tournament.

1. Sudden Death – With the start of knockout-round play, it’s single-elimination style just like the NCAA Tournament. Look for handball Cinderellas like Tunisia to knock a strong Croatian team into a long, four-year wait until the next Olympics in the late game Tuesday.

2. Tight, physical defense – The importance lock-down defense is more similar to college basketball than to the NBA regular season. Even the short Korean team got physical, getting hands on shots and climbing taller players like trees. And the crashing of bodies for rebounds reminds us of the ruthless interior play of Big East teams.

3. Don’t know the names? Doesn’t matter – No one will blame you for not knowing the starting lineup of Syracuse or Iceland, but players fit into archetypes, like Ivan Cupic of Croatia. One of the shortest guys on the court, Cupic weaves through defenses to drive opponents batty — like that pesky, quick-shooting guard your team can’t stop. As one of the top goal-scorers, his post-goal fist pumps are a gut-punch to opposing goalkeepers.

4. A college atmosphere with international flair – It’s all neutral for the knockout round since the Brits are eliminated. But fans have gathered from across Europe to give the matches a college basketball feel, especially the loud, chanting Hungarian fans who drape the Copper Box in green and red.There’s even schadenfreude: Denmark fans in the crowd rooting for Korea to defeat their European rivals. Big tournaments create strange international bedfellows.

5. Love for the ladies – While the focus may be on the men’s tournament, don’t forget the women’s games happening on opposite days. The games have been entertaining and a demonstration of parity: Even Denmark, which won three straight Gold medals from 1996 through 2004, missed the knockout round with a 1-4 record.

6. More eyeballs, higher volume – Just like college basketball teams usually move from smaller gyms to NBA arenas in March, so will handball teams. For the men’s knockout round and the women’s final four the games shift from the cozy 5,000-seat Copper Box to the 12,000-seat Basketball Arena. If the cheers from crazed Hungarians didn’t destroy your ears during the preliminary round, the decibel level is about to double.

7. The gym teacher X-factor – Basketball fans know that gym teacher James Naismith invented the game to keep students in shape during winter. Handball may have its origins in ancient Rome and Greece, but Denmark’s Holger Nielsen created the first set of rules in 1904 and Germany’s Karl Schelenz developed the modern rules 15 years later. One guess at what their occupations were.

8. Watch early, watch often – One of the best aspects of being at the NCAA tournament and Olympic handball tournaments is watching games all day long, at the stadium or a screen. All of the games are streaming live at NBCOlympics.com. Just make sure to hide the video box from your boss, March Madness-style.

USC Baseball’s Run of Poor Seasons All Goes Back to Recruiting

(Photo Credit: Shotgun Spratling/College Baseball Daily)

The Trojans have not put a winning team on the field since 2005. (Photo Credit: Shotgun Spratling/College Baseball Daily)

There are many reasons USC named its baseball stadium after Rod Dedeaux. He spent 45 years as head coach. He won an unmatched 11 College World Series titles, including five in a row from 1970 to 1974. He was named Baseball America’s “Coach of the Century.”

But many of the students who came through USC during his tenure from 1942 to 1986 probably appreciate one thing most: the free beers.

“Rod Dedeaux used to buy a keg and set it behind the visitor’s dugout,” says Steve Lopes, USC’s chief operating officer and chief financial officer. “Red cups in the stands. A couple hundred kids would show up.”

Not that USC baseball necessarily needed a steady flow of alcohol to be enjoyed while Dedeaux was head coach. He won 70 percent of his games, helped to develop 59 Major League players and led the Trojans to 28 conference titles.

“They were like the Celtics winning championships in basketball,” says Aaron Fitt, national college baseball writer for Baseball America. “They were royalty in college baseball.”

But the kings have lost their crown in recent years. The Trojans have not had a winning season since 2005, the longest drought for a school that has been playing baseball since 1889. In those seven years, they have produced just two Baseball America All-Americans after having 10 such players the previous eight years. The baseball powerhouse has become a lightweight, but why?

In 1976, Los Angeles Times columnist Jim Murray wrote that Dedeaux’s USC program was “the greatest farm club in the history of the major leagues… and the most consistent supplier of major league talent the past 10.” Over the last several years, though, USC has not been able to get top high school players to the “farm club,” and the team on the field floundered to the longest span in Trojans history without making the NCAA Tournament.

Public vs. Private

“The lifeblood of our athletics program is recruiting,” Lopes says. “You get the best players, you’ll win the most of the games.”

College baseball programs are limited to 11.7 scholarships per team (not per year, per team), but can give student-athletes anywhere from a 1-percent scholarship to a full ride. College baseball teams usually carry more players than the 25-man rosters in Major League Baseball. With so few scholarships to give out, private schools like USC are often at a disadvantage.

The majority of scholarships given out are 25 percent or 50 percent. Trojans head coach Dan Hubbs may go into a player’s home and offer a half-scholarship to play for USC. It’s not bad, but then the player’s parents still have to pay about $25,000 per year for him to attend the university.

When UCLA head coach John Savage offers a half-scholarship to a California native, the remaining cost for parents is only $16,101 per year, going by estimated student budgets provided by UCLA. That difference of $36,000 over four years can have a substantial impact in a student-athlete’s choice of school, and public universities like UC Irvine (six straight NCAA Tournament appearances from 2006 to 2011) and Cal State Fullerton (seven College World Series appearances since 1999) can reap the benefits of recruiting athletes from the high school baseball hotbed of California and being a less expensive option than USC.

However, college baseball is not completely dominated by public schools. Universities like Stanford, Rice and Vanderbilt consistently build quality teams despite expensive tuitions and the same 11.7-scholarship limit.

Stanford is the most unique school in Division I, Lopes says. He cites the university’s ability to offer a full scholarship to any accepted student with a single parent making less than $60,000 or a family making less than $120,000. The same goes for potential players at Rice who come from certain income levels. A questionnaire on the Rice Athletics website asks potential recruits to identify family income level: Less than $80,000; Between $80,000 to $120,000; Between $120,000 to $150,000; and Greater than $150,000. The need-based academic scholarships they can offer do not take any slice of the 11.7 baseball scholarships each program has.

“It takes their athletic dollars much further,” Lopes said.

Schools can’t combine acadmeic aid and athletic aid, so USC Athletics could not piece together a half-tuition academic merit scholarship with a half-tuition baseball scholarship to create a full ride. Rice and Vanderbilt, like Stanford are all have smaller student bodies and a larger endowment per undergraduate than USC, giving those schools a better ability to offer academic aid.

School Number of Undergraduates Endowment Endowment per Undergraduate
USC 17,414 $3.489 billion $200,356
Stanford 6,999 $17.04 billion $2,434,634
Rice 3,708 $4.5 billion $1,213,592
Vanderbilt 6,796 $3.399 billion $500,147

(Source: National Association of College and University Business Officers and Commonfund Institute)

But California’s public universities have been less expensive than USC for decades, and it did not stop the Trojans from being one of the powerhouses of college baseball.

“USC doesn’t have quite the same academic reputation as Vanderbilt and Stanford, but there’s no reason USC shouldn’t be able to find talent,” says Shotgun Spratling, who covers the Southern California region for College Baseball Daily. “There are plenty of players that come from families living comfortably enough for the tuition difference at a private school to not be an overwhelming burden.”

One decision in particular changed the program’s fortunes over the last decade.

A Short-Lived Head Coach

Mike Gillespie led USC’s baseball teams to the NCAA Regionals 15 times in 20 seasons as the Trojans head coach, making four appearances in the College World Series. He “retired” from the program after the 2006 season, only to be hired at UC Irvine less than 16 months later.

His retirement was more likely a case of being forced out after only one winning season in his last four years as head coach. However Gillespie was relieved of duties, the team was taken over by his son-in-law Chad Kreuter, a former USC catcher who played in the Major Leagues and had minor league managing experience before returning to Troy.

Despite Kreuter’s professional baseball experience, he had never been a head coach at the college level, and he quickly had problems getting top players to USC.

“He didn’t know what he was doing,” Fitt says. “I hate to put it so bluntly, but when it comes down to it, he didn’t know how to recruit to the college game… It was an unmitigated disaster.”

Fitt says Kreuter’s focus was on recruiting big-name players. The problem was, he says, most of those guys had “no chance of showing up to school” over signing a pro contract out of high school.

“So then they were decimated the next fall,” Fitt says. “None of the guys showed up. It’s just not how you win in college baseball, and he never quite got it.”

Another issue with bringing in Kreuter was that he had been around pro baseball for so long that he had no sense of how college coaches bring in high school players.

“How does he know where the recruits are? How does he evaluate talent or have a network of [high school] head coaches?” Lopes asks. “You need a network of people who have built relationships.”

Poor recruiting classes led to a disastrous four-year stint for Kreuter. His teams went 39-63 in conference play, never finishing better than fifth in the Pac-10 conference. Meanwhile, Gillespie’s UC Irvine teams continued the success started by former head coach Dave Serrano. Gillespie went 69-27 in conference play and led the Anteaters to the NCAA Tournament in each of his first four seasons at the helm.

“Mike Gillespie is one of the great coaches in college baseball, certainly the most respected coach in the West Coast,” Fitt says. “They always talk about how Gillespie gets the most out of his players and his team is just so well coached.”

Building Back Up

USC is still recovering from Chad Kreuter’s tenure, even though he was fired in August 2010. “The cupboards were bare,” as Fitt puts it, for new skipper Frank Cruz. After coaching as an assistant under Gillespie from 1993 to 1996, Cruz was the head coach for 12 seasons at nearby Loyola Marymount, then served as a volunteer assistant under Kreuter. He became USC’s interim head coach in 2011 after Kreuter was fired. The team continued to flounder during Cruz’s two seasons (including an 8-22 Pac-12 record in 2012, the most conference losses for USC since 1985).

Cruz was fired just days before the start of the 2013 season for “knowingly violating” NCAA rules that restrict the amount of time players can participate in activities supervised by coaches. That left the Trojans in the hands of Dan Hubbs. It is his first college head-coaching job, but unlike Kreuter, Hubbs brings 13 years of experience as an assistant at Cal and USC.

It continues be slow going for the Trojans this year, with a 12-20 record and a 5-7 mark in Pac-12 play.

“He’s made some questionable decisions, which is to be expected of a coach without much experience in this role,” Spratling says. “But he wasn’t dealt a full hand.”

Though Hubbs is not labeled “interim” head coach like Cruz was, Lopes says he will be evaluated after the season. His successful run as Cal’s pitching coach is certainly a mark in his favor, according to Fitt. Hubbs is in charge of a roster with 16 true freshmen that is still hovering in the bottom half of the Pac-12 conference.

“They’re not overly talented, they’re very young in certain areas,” Fitt says. “But they battle, and I think that’s a sign of good coaching and a program I think is headed in the right direction.”

The pedigree of great college baseball is unmistakable at USC. Fans see it every time they walk up to the stadium. Banners marking the Trojans’ 12 National Championships line Mark McGwire Way as people approach the entrance to Dedeaux Field. They see the face of Gillespie on the scoreboard, the only other man besides Dedeaux to lead USC to a College World Series title.

The history of the USC baseball program is obvious, from the beer-soaked National Championship days of Dedeaux to the success of Gillespie. Now it is time for Hubbs to live up to it.

Bowl Games Prosper Despite Schools Losing Money On Unsold Tickets

(Justin Matlock/Creative Commons)

(Justin Matlock/Creative Commons)

College football fans had been waiting years for it. College presidents had talked around it. Coaches and players longed for it. Last June, it was finally confirmed.

Playoff.

It was the word everyone was waiting to hear, and starting with the 2014 season, college football will have a playoff for its national championship after more than a decade of determining a winner with the Bowl Championship Series.

The new system will not look like basketball’s 68-team March Madness, though, nor any of the other large-scale tournaments the National Collegiate Athletic Association (NCAA) uses to decide a champion in most of its 22 sports. Instead, football will have just a four-team playoff; three games in a winner-take-all.

Such a small playoff means college football’s unique postseason setup will remain in place: 35 “bowl games” played in by 70 teams that finished the regular season with at least a .500 record (fewer losses than wins). The bowl system, originating from the inaugural 1902 Rose Bowl game in Pasadena, sees bowl organizing committees paying conferences for their member teams to end the season in the December or January games.

The conferences (think Big Ten, ACC, Pac-12) then divvy the money to their members, even those that did not make a bowl game after a losing season. For the schools that go bowling, the trip can become a costly endeavor. Bowl-bound schools have to pay the travel expenses and hotel costs for their team, coaches and marching band, though that is common for every road game they play.

The real costs often come in the form of ticket guarantees; schools are allotted thousands of game tickets that are theirs to sell. When the team is playing in a prestigious bowl like the Rose Bowl or National Championship, or in a highly-anticipated matchup close to home, the allotments are a blessing. Schools playing in these types of games can sell out of tickets.

Then there’s the curse. If a school accepts an invitation to play in a bowl far away, a low-profile game or a bowl in which they had recently participated, fewer fans shell out the money to travel and attend the game.

DATA: See the numbers we compiled from the tax forms of non-profit bowl games.

From 2004 to 2011, 307 Division I Football Bowl Subdivision (FBS) football teams reported breaking even or losing money on the season, according to data provided by the schools to the federal Office of Postsecondary Education. Of those 307 teams, 98 played in bowl games after a season that was a financial break-even or loss.

Keep in mind, many of these 98 teams represented schools that are rarely financial winners on the gridiron. For example, every year from 2004 to 2011 the University of Memphis football program reported breaking even or losing money. There were two seasons in which the Tigers made a bowl game and broke even, and also two seasons in which the Tigers made a bowl and lost money. The team’s postseason status did not greatly alter the bottom line, and that fact is true of many lower-tier programs in Division I FBS.

However, large public schools going to “elite” BCS bowls can feel the impact of ticket requirements. In recent years, West Virginia and Virginia Tech lost money to play in the Orange Bowl in Miami Gardens, according to a report by the Los Angeles Times. The bowl allots 17,500 tickets to each participating school, meaning almost half the stadium’s seats have to be sold by the two schools.

Another example of “big bowls” meaning big costs is that of the University of Connecticut. Over the last decade, the largest financial loss the Connecticut Huskies underwent came in the 2010-11 football season, when the Huskies made the Fiesta Bowl in Glendale, Arizona. Despite filling their home stadium to 95 percent capacity during the regular season, Connecticut could only sell 2,771 of their 17,500 Fiesta Bowl tickets, according to the school newspaper. Despite a winning season on the field, the football team ended the fiscal year with a loss of $1,534,938.

Keep in mind that a school’s inability to sell tickets does not necessarily represent fan apathy, just the free market. The face value for Orange Bowl tickets run from $75 to $250, but smart shoppers could get in to the stadium via secondary ticket sellers like StubHub, where the budget-conscious fan could buy a seat for as low as $48.

Money Maker for Committees

While schools often lose money in the process of accepting a bowl invitation and playing in the game, the bowl committees themselves come out stronger financially.

We analyzed the tax forms of 12 non-profit bowl committees since 2005, ranging from high-profile games like the Rose Bowl, mid-tier games like the Sun Bowl and smaller games like the GoDaddy.com Bowl.

For the 90 games studied, 68 turned a profit for the fiscal year. Since 2005, all 12 bowl committees have seen at least a 7 percent rise in net assets, and more than half the committees have doubled their net assets.

Translation: all of the bowl committees studied have more financial assets than they did in 2005 (before the economic downturn), some substantially more. It should be no surprise that about half the bowl games in college football were founded in the last 16 years. It seems to be a good financial proposition.

Bowl Game Net Asset Change

Bowl games are gaining strength financially at a time when attendance at the games is actually dropping. The average attendance for the most recent bowl games was 49,222 fans per game, the lowest average since 1978-79 according to an analysis by Jon Solomon of AL.com.

Last season, 33 of the 35 bowl games were televised by Disney-owned ESPN, ESPN2 or ABC. However, ESPN is no longer just in the business of showing the bowl games on TV. Not all bowls are run by non-profit committees bringing the games to their hometowns. ESPN Regional Television now owns and operates seven annual bowl games. Operating even one bowl game is an expensive project. Our analysis showed annual expenses for non-profit bowl committees running from $2.8 million (New Orleans Bowl) to $17 million (Orange Bowl).

ESPN is not a non-profit, of course. They are in the business of making money via commercials and distribution fees to cable networks. And with the broadcast rights for bowl games climbing higher and higher, it would appear ESPN has found it a better business decision to run the show itself.

Bowls for schools that lost money

For the Cotton Bowl, a Staff Handsomely Paid

Any conversation about schools being required to take on millions of dollars in bowl ticket obligations cannot be complete without pointing out that some bowl executives make far more than their counterparts running Division I athletic departments.

The average annual compensation for “current officers, directors, trustees, and key employees” for bowl games is about 5.5 percent of total expenses, according to the bowls’ Tax Form 990s. One bowl is an outlier in compensating its staff, the AT&T Cotton Bowl Classic in Texas.

Keep in mind that the Cotton Bowl game is no longer played at the Cotton Bowl stadium, the depression-era venue in Dallas’ Fair Park. Starting with the 2010 contest, the Cotton Bowl classic was moved to $1.3-billion Cowboys Stadium in Arlington. The Cotton Bowl stadium now hosts a new game called the Heart of Dallas Bowl.

Confusing enough for you?

During the first year at Cowboys Stadium, Cotton Bowl Classic officials were paid $701,545, or 6.4 percent of the bowl’s total expenses, according to the Form 990 filed by the bowl. Two years later in 2012, officials were paid $1,754,937, or 15.1 percent of total expenses. That percentage was the largest we found of any bowl game since 2005.

It’s important to note, at least in the case of the Cotton Bowl Classic, the millions are not doled out to executives to run one game per year. For the 2013 season, the officials will also organize two regular season contests at Cowboys Stadium, Louisiana State vs. Texas Christian on Aug. 31 and Notre Dame vs. Arizona State on Oct. 5.

In 2014, Cotton Bowl officials are in charge of Texas vs. UCLA, Arkansas vs. Texas A&M and Florida State vs. Oklahoma State before hosting the National Championship Game on Jan. 12, 2015.

“That’s almost a regular season worth of games,” said Michael Konradi, vice president of external affairs for the Cotton Bowl.

Hosting four college football games does not exactly match up to the six regular season home games schools usually host, it represents more than the one Outback Bowl game organized by the Tampa Bay Bowl Association. CEO Jim McVay was paid a compensation package of $814,935 in the fiscal year 2012. That figure was second among bowl officials behind Cotton Bowl CEO’s total package of $1,028,280.

To compare that to other non-profits in college athletics, 100 of the 114 athletic directors of Division I FBS schools earn less than McVay’s compensation package, according to research done by USA TODAY. Athletic directors are the heads of athletic departments for schools, with responsibilities for many sports beyond football.

Ticket Revenue, Attendance Sometimes Don’t Line Up

An example of curious accounting for bowl games can be found in the ticket sales revenue reported by the GoDaddy.com Bowl in Mobile, Alabama, formerly the GMAC Bowl. For three straight years (2006 to 2008), the bowl reported ticket sales of exactly $1,375,926 on each tax Form 990. Such a figure could be accurate if the GMAC Bowl had filled 40,000-seat Ladd-Peebles Stadium with fans. It did not.

  • 2005 GMAC Bowl (tax report 2006): 35,422
  • 2007 GMAC Bowl: 38,751
  • 2008 GMAC Bowl: 36,932

The 2009 GMAC Bowl reported ticket sales of $1,375,927 (up one dollar) before the sales numbers changed to lower figures in later years. The two possibilities are that GMAC Bowl officials had fudged the ticket revenues on their tax forms, or the revenue was counting thousands of seats sold to schools that went unused.

GoDaddy.com Bowl officials were not available for comment.

A Change Afoot?

The ticket requirements will not be changing for the 2013-14 bowl season. The contracts which line out obligations for ticket sales are agreed upon by the bowls and the conferences, not the individual schools. But after this season, the so-called “bowl cycle” of rotating the National Championship game resets, opening the door for the establishment of the four-team College Football Playoff. Conferences will have a chance to renegotiate their bowl contracts.

“Conferences have the leverage right now,” the Cotton Bowl’s Konradi said.

In addition, bowl directors expect a change in team selection in the contract renegotiations. Traditionally, individual bowl committees have controlled which teams to invite. New contracts could give more power to the conferences to assign where member schools play their postseason games.

With the conferences in control, it is more likely that future bowl designations will better match the financial needs of member schools. In 2008, 2009 and 2011, Virginia Tech lost money playing in the Orange Bowl in Miami. According to university records analyzed by The Arizona Republic, the school would have lost a total of $5.1 million over the three games, but the Atlantic Coast Conference absorbed the cost for several thousand tickets.

Even with the financial hit, schools continue to accept bowl invitations for any number of reasons. There is still prestige involved for many of the bowl games, and the television exposure can help with recruiting players. In addition, teams are only allowed to practice after the end of the regular season in early December if they make a bowl game. Even if the contest is a low-tier game, coaches get more instruction time and full practices to prepare their team for the following season, as NCAA rules limit teams to 15 spring practices in March and April.

Still, with our analysis finding that about one-third of Division I FBS football teams in any given season show no profit, schools may be faced with tough decisions if the financial burden is too much to bear to go bowling.

Quentin, Greinke Start Brawl as Padres Fall 3-2

Carlos Quentin

A two-act brawl between the Padres and Dodgers was not enough to inspire San Diego to a series win over its L.A. rivals. Juan Uribe hit a go-ahead pinch-hit home run in the 8th inning to put the Dodgers past the Padres 3-2.

The Dodgers (6-3) struck in the first inning when former Padres first baseman Adrian Gonzalez, treated to his share of boos in his return to San Diego, hit a two-run home run to right off starter Jason Marquis. The Padres kept from extending its lead for a while, stranding 12 Dodgers baserunners as L.A. went 0-for-4 with runners in scoring position. The Padres (2-7) got a run back in the 4th when Jedd Gyorko walked, Nick Hundley singled and Gyorko scored on a wild pitch by Dodgers starter Zack Greinke.

The fisticuffs began when Carlos Quentin was hit on the left side by Greinke’s 3-2 pitch and immediately charged at Greinke and rammed him with his left shoulder. The dugout and bullpens cleared and the crowd of 24,610 at Petco Park finally got noisy with competing chants of “Let’s Go Dodgers” and “Beat L.A.” After some pushing and shoving, the sides began to separate and the relievers returned to the bullpen.

The peace was not maintained for long, though, as Dodgers infielder Jerry Hairston, Jr. rushed across the field, pointing his finger at the Padres’ dugout. San Diego’s Yonder Alonso ran up to Hairston, and both sides rushed back out toward the pitcher’s mound to start the brawl back up. Unofficially, home plate umpire Sam Holbrook ejected Hairston, who was not in the game, Quentin and Matt Kemp. Greinke also exited with a broken collarbone. The fighting extended into the stands, with at least one fan being carried off in handcuffs and others having to be separated by security.

Quentin has a history with Greinke, and an even more recent history of being hit by Dodgers pitchers. In 2009, Greinke (then a member of the Kansas City Royals) threw Quentin of the Chicago White Sox a pitch that hit him between the shoulders. Quentin took one step toward Greinke before the home plate umpire stopped him from charging the mound. The Padres outfielder was hit by a pitch in the right wrist by the Dodgers’ Ronald Belisario on Tuesday, the 115th time in his Major League career he was hit by a pitch.

Chris Capuano entered to pitch for the Dodgers and threw a wild pitch past the first hitter Alonso, sending Quentin’s replacement Alexi Amarista to second base. Alonso hit a game-tying RBI single to left, but the Padres could not tack on any more, as Alonso was doubled off at second after running home on a shallow pop-up that was just barely caught by new Dodgers center fielder Skip Schumaker.

Marquis became the third Padres starter of the series unable to get past the fifth inning, allowing seven hits, four walks and two runs over 102 pitches. San Diego was unable to scratch across a run against any of the five Dodgers relievers. The Padres’ last  opportunity with runners on came with Gyorko singling in the 8th inning, but L.A. relief pitcher Paco Rodriguez got pinch hitter Mark Kotsay to fly out to end the frame on his only pitch.

QUOTE CITY: DODGERS

Manager Don Mattingly – “Nothing happens if [Quentin] goes to first base… because you know he’s not throwing at you 3-2 in a 2-1 game. That’s zero understanding of the game of baseball. He shouldn’t play a game until Greinke can pitch.”

“Their guy charges the mound, being an idiot, and our guy’s gonna be out for however long. And their guy will probably be playing again in three days. It’s a joke.”

Pitcher Zack Greinke – “I just feel like he’s just trying to get people to throw at him away. I don’t know anyone that has hit him on purpose. I know I haven’t.”

Infielder Jerry Hairston, Jr. – “He’s not gonna hit you after he’s got two strikes on him. That’s unacceptable. This is the show, man. You don’t do that stuff here. My teammate now has a broken (expletive) collarbone… Two strikes and he gets hit. And he charges the mound? That’s… sorry. Can’t do that.”

“He was wrong. I don’t know Carlos at all. I really don’t. He was wrong. I think if he looks back on it, he’s gonna say that he was wrong.”

Outfielder Matt Kemp – “I think Carlos Quentin went to Stanford? Something like that? Yeah, I heard there’s some smart people at Stanford. That wasn’t too smart.”

QUOTE CITY: PADRES

Outfielder Carlos Quentin – “Unfortunately, that situation could have been avoided… I’ve been hit by many pitches in my career, you guys know that. I can tell you I’ve never responded in that fashion.”

What did he say?

“I don’t know. Look at his body language and look at the video. It’s clear as day.”

So if he doesn’t say anything, you don’t charge?

“There’s a chance I don’t. but like I said, there’s a history there. There’s a reason why I reacted the way I did. And who knows what would have happened if he didn’t say anything, or if he motioned that it wasn’t intentional.”

Manager Bud Black – “I think there’s some history between the two. I’m not gonna get into that. I don’t know all the details. Q’s been hit a lot of times, as you guys know.”

Pitcher Jason Marquis – “Obviously I didn’t know [Greinke] broke his collarbone, and it stinks that he did. Sometimes you make your own bed by the choices you make and you gotta live with it.”